
By Varun Prashar – 12+ yrs engineering + deep AI expertise, fast AI-assisted development, across fintech/healthcare/e-commerce
Updated: April 2026 · 14 min read
Let me be upfront with you: website speed is one of those topics where everyone
knows it matters, but very few teams actually fix it systematically.They’ll compress an image here, install a cache plugin there, and then wonder why their PageSpeed score is still a 52 on mobile. Sound familiar?The problem isn’t effort – it’s order of operations. Most people fix the wrong things first.This guide is going to change that. We’re going to walk through exactly how to diagnose
what is slow, prioritize the fixes that move the needle, and build a monitoring habit so you stop playing
whack-a-mole with your performance score.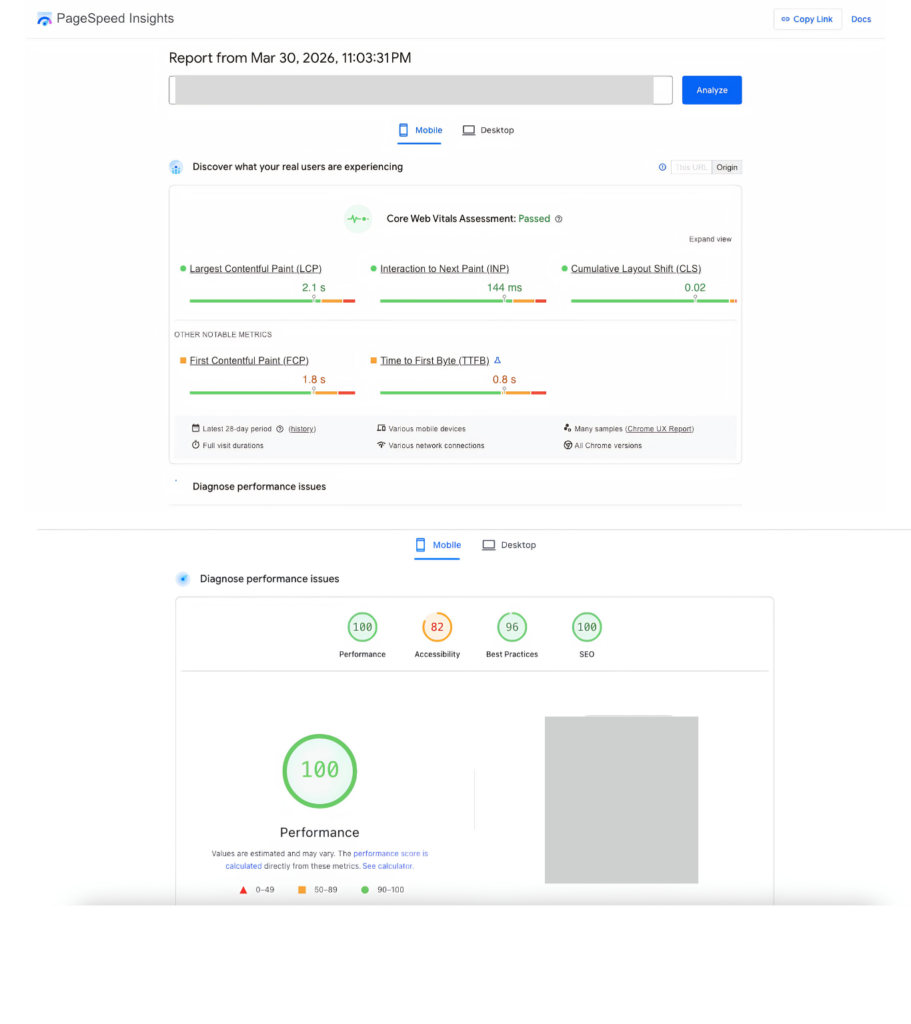
First, Let’s Agree on What “Speed” Actually Means in 2026
Before we touch a single setting, we need to speak the same language. Because when someone says “my site is slow,” they could mean four completely different things – and each one has a different fix. Google measures your site’s speed using three
Core Web Vitals
These aren’t abstract lab scores – they’re sampled from real Chrome users visiting your site, and they directly influence your search rankings.
Largest Contentful Paint (LCP)
–
“How fast does my page look loaded?”
This measures how long it takes for the largest visible element (usually your hero image or headline) to appear on screen. If a user is staring at a blank or partially-loaded page, LCP tells you how long that torture lasts. → Target: under 2.5 seconds.
Interaction to Next Paint (INP)
–
“Does my site feel sluggish when I click things?”
INP replaced First Input Delay (FID) in 2024, and it’s a much stricter metric. It measures the delay between a user doing something (clicking a button, tapping a menu) and the page actually responding. If your site feels “laggy,” this is why. → Target: under 200ms.
Cumulative Layout Shift (CLS)
–
“Why does the page keep jumping around?”
You know that frustrating moment when you’re about to click a button and an ad loads above it, pushing everything down? That’s CLS. It’s a score, not a time – the lower, the better. → Target: under 0.1.
Pro tip:
Don’t just look at your homepage. Run PageSpeed Insights on your highest-traffic landing pages, product pages, and any page with a form. A perfect homepage score means nothing if your checkout page scores a 41.
The Tools You Actually Need (And How to Use Them Together)
There’s no shortage of speed testing tools, but most people use them wrong – they run one test, see a number, and start randomly fixing “Opportunities.” Here’s how to use them properly.
Google PageSpeed Insights is your starting point. It gives you field data
(real Chrome user experience) alongside lab data (simulated test). The field data section is what actually matters for SEO. If a metric shows “Insufficient data,” your site doesn’t get enough traffic for Google to have collected it yet – which means the lab score is all you have to work with.
GTmetrix and WebPageTest show you waterfall charts – a visual timeline of every single resource your page loads. This is where you’ll spot things like a single third-party
script taking 1.8 seconds to respond, or 47 separate CSS files loading one by one. PageSpeed won’t tell you which specific resource is killing you; waterfalls will.
Chrome DevTools (the Performance tab) is the power tool for JavaScript problems. If your INP is poor, this is where you’ll find the specific function that’s blocking your main thread for 600ms. It’s intimidating at first, but you only need to look for one thing: the red “Long Task” blocks.
The Most Common Causes of Slow Sites (In Order of How Often I See Them)
1. Unoptimized Images – The #1 Offender by Far
Images routinely account for 50–70% of total page weight on most sites. And the problem isn’t just file size – it’s the combination of the wrong format, wrong dimensions, and loading them when they don’t need to be loaded yet.
A marketing team uploads a 4200×2800px PNG straight from their camera roll into the CMS, the theme scales it to 800px wide with CSS, and the browser still downloads the full 3.8MB file. This is happening on more sites than you’d think.
The fix:
- Convert everything to WebP (or AVIF for even better compression). You’ll typically save 30–50% on file size with no visible quality difference.
- Resize images to their actual display size before uploading. Not “approximately.” Exactly.
- Add loading=”lazy” to every image that isn’t in the top viewport. Native lazy loading is supported in all modern browsers and requires zero JavaScript.
- Always define width and height attributes. Without them, the browser doesn’t know how much space to reserve, and you’ll get layout shifts (killing your CLS score).
2. Server Response Time (TTFB) – The Problem No Plugin Can Fully Fix
Time to First Byte (TTFB) is how long it takes your server to start sending anything back after a browser requests a page. If your TTFB is consistently above 600ms, you have a server problem – and no amount of image compression will fix it.
This is the silent killer. People spend hours optimizing assets while their server is taking 1.2 seconds just to begin responding.
The fix:
- If you’re on budget shared hosting, move. Managed WordPress hosts like Kinsta, WP Engine, or Cloudways run LiteSpeed servers, have built-in caching, and will cut your TTFB to 100–250ms. The cost difference is real, but so is the performance difference.
- Implement full-page caching. For WordPress: WP Rocket or LiteSpeed Cache. This means your server generates the HTML once and serves a static cached version to everyone else – instead of rebuilding the page from scratch on every request.
- Deploy a CDN (Cloudflare is the easiest starting point, and the free tier is genuinely good). A CDN caches your assets at edge servers around the world, so a user in São Paulo doesn’t have to wait for a server in Frankfurt.
3. JavaScript Bloat – The Invisible INP Killer
JavaScript is the most performance-sensitive resource on your page. Unlike images (which are downloaded and displayed), JavaScript is executed – it runs on the user’s device and competes with their interactions for control of the browser’s main thread.
When a user clicks something on your site, the browser needs to handle that click. But if a JavaScript task is running at that exact moment (even a benign analytics event), the user’s interaction gets queued. That queue time is your INP.
The common culprits:
- Chat widgets (Intercom, Drift, Crisp) – these can add 300–500KB of JavaScript that executes immediately on page load
- Tag Manager setups that have accumulated 20+ tags over three years with no one auditing them
- A/B testing scripts that load synchronously in the <head>
- Unused code from plugins or npm packages that got imported once and never removed
The fix:
- Delay non-critical scripts until after the page is interactive. Add defer or async to script tags. Better yet, use a script loader that fires scripts only on user interaction (scroll, click, or a timer after load).
- Do a genuine third-party script audit. Open the Network tab in DevTools, filter by domain, and look at every third-party request. Ask: “If I removed this, would a real user notice?” You’ll often find 3–4 things you can cut.
- For React/Vue/Next.js apps: implement code splitting. Your users on the homepage shouldn’t download the JavaScript for your account settings page.
4. Render-Blocking CSS and Fonts
Your browser builds the page in order. When it hits a CSS file or a synchronous script in the <head>, it stops and waits for that resource to fully download before it continues. This is “render-blocking.”
Google Fonts is the most common example. A page that loads four Google Font families is making four separate requests – each of which blocks rendering until it completes.
The fix:
- Inline your critical CSS – the styles needed to render above-the-fold content. Load the rest of your stylesheet asynchronously with rel=”preload”. Plugins like WP Rocket or Critical (npm) can automate this.
- For fonts: limit yourself to 1–2 font families, use font-display: swap (this tells the browser to show system font text immediately and swap to your custom font when it loads), and preload your most important font files.
- Self-hosting fonts is almost always faster than loading them from Google’s CDN once you account for the DNS lookup time.
Platform-Specific Fixes: WordPress and Shopify
WordPress
A slow WordPress site is almost always three things layered on top of each other: a heavy theme, too many plugins, and no caching. Fix them in that order.
Start here:
- Run a PageSpeed audit on your key pages. Note your LCP element (usually identifiable in the “Diagnostics” section).
- Switch to a lightweight theme if you’re running something like Divi, Avada, or an old WooCommerce theme. GeneratePress, Astra, and Kadence are genuinely fast and still flexible.
- Install 10WebBooster, WP Rocket or LiteSpeed Cache and run through the setup wizard. Enable page caching, Gzip/Brotli compression, and the lazy loading option.
- Audit your plugins. Deactivate them one by one and retest. You’ll often find one plugin responsible for a disproportionate amount of slowdown – usually something that injects a script on every page load, like an old SEO plugin, a broken social share widget, or a currency converter you added two years ago.
- Use an image optimization plugin (Imagify or ShortPixel) with WebP conversion enabled. Run a bulk optimization on your existing media library.
Pro tip: Use the Query Monitor plugin to identify slow database queries. Some plugins make 40+ database calls on a single page load. That’s a TTFB problem disguised as a plugin problem.
Shopify
Shopify handles hosting, caching, and CDN for you – so your bottlenecks are almost entirely theme-related and app-related.
Start here:
- Audit your installed apps. This is the single highest-ROI action for most Shopify stores. Apps inject JavaScript into your storefront, and they don’t compete with each other – they stack. I’ve seen stores with 22 apps, each adding their own script, resulting in 4MB of JavaScript on a product page.
- If you’re not on an Online Store 2.0 theme, switch to one. Dawn (Shopify’s free default) is genuinely well-optimized. Third-party OS 2.0 themes like Refresh or Symmetry are also solid starting points.
- Strip autoplay videos and parallax scroll effects from your homepage. They look impressive in demos and they devastate LCP scores in practice.
- Compress and resize product images before uploading. Shopify auto-serves WebP, but it can’t fix a 6000×4000px source image – it’ll just serve a very large WebP.
- For each app you keep, check whether it’s loading its script on every page or only on relevant pages. A review app should only load on product pages. A returns portal only needs to load on the account page.
Core Web Vitals: The Targeted Fixes
Once you’ve done the foundational work above, these are the specific levers for each metric.
To improve LCP specifically: Add <link rel=”preload” as=”image” href=”your-hero-image.webp”> in your <head>. This tells the browser to start downloading your hero image immediately, rather than discovering it partway through parsing the HTML. This single change can drop LCP by 300–800ms on image-heavy pages.
To improve INP specifically: Use Chrome DevTools’ Interaction to Next Paint panel to record a page interaction. Look for “Long Tasks” (red blocks) that overlap with your click events. The goal is to break those long tasks into smaller chunks using setTimeout or the scheduler.postTask() API, so they yield control back to the browser between chunks.
To improve CLS specifically: The three most common CLS sources are: images without defined dimensions, ads injected into the content area, and late-loading fonts causing text reflow. Fix all three and most sites will drop from “Poor” to “Good” on CLS almost immediately.
Building a Performance Monitoring Habit
Here’s the thing about website speed: it degrades over time. Your developer adds a new chat widget. Marketing installs a heatmap tool. Someone uploaded a beautiful 8MB JPEG for the homepage banner. Three months later, your LCP is back to 4.2 seconds and nobody knows why.
The fix is treating performance like you treat security – not as a project, but as an ongoing discipline.
Practical monitoring setup:
- Run PageSpeed Insights on your five most important pages once a month. Screenshot the results. You want a baseline to compare against.
- Set up Google Search Console and watch the Core Web Vitals report. It shows real-user data across your whole site, segmented by mobile and desktop, and it flags pages that have crossed into “Poor” territory.
- Define a performance budget: a maximum total page size (1.5MB is a reasonable starting point for most sites), a maximum JavaScript size, and LCP/INP targets. Make these part of your publishing or deployment checklist.
- If you’re on a larger team: integrate Lighthouse into your CI/CD pipeline using tools like lighthouse-ci. This catches regressions before they go live, not after.
The Quick-Start Checklist
If you’ve read this far and you want to start today, here’s your prioritized action list:
Do these first (highest impact):
- Run PageSpeed Insights on your top 5 pages. Note your LCP, INP, and CLS scores.
- Check your TTFB in GTmetrix. If it’s over 600ms, hosting/caching is your first fix.
- Audit and compress all images. Convert to WebP. Add lazy loading to below-fold images.
- Audit your third-party scripts. Remove anything you can’t justify.
Do these second:
- Install or configure a caching plugin (WordPress) or audit your app list (Shopify).
- Enable a CDN if you don’t have one.
- Defer non-critical JavaScript.
- Add font-display: swap to your font declarations.
Do these for the long haul:
- Monthly PageSpeed check on key pages.
- Preload your LCP image element.
- Set a performance budget and enforce it.
Final Thought
Website speed optimization isn’t a one-time sprint – it’s more like a code review habit. The teams that consistently have fast sites aren’t doing anything magical. They’re just catching regressions early, staying opinionated about third-party scripts, and running a monthly audit.
Start with the TTFB and your images. Those two areas alone will account for the majority of your performance problem on most sites. Everything else is refinement.
If you want to share your PageSpeed URL or tell me what platform you’re on, I’m happy to help you build a specific action plan from there.